2010 update:
Lo, the Web Performance Advent Calendar hath moved
Dec 2 This is the second in the series of performance articles as part of my 2009 performance advent calendar experiment. Stay tuned for the next articles.
While theoretically you can speed up your site by just blindly following advice from this blog and other sources, it is much better to understand what's going on on the page and what you're dealing with. That's where the tools come in. Some tools give you insight about the network activities going on between the server and the browser (packet sniffers), some help you benchmark code execution on the client (profilers), some even give recommendations specific to performance improvements. You should aim at mastering as many of the tools as possible, because there's no single one that is The Tool. And that's not a bad thing, it's normal, because performance optimization is a multi-discipline activity touching a lot of different aspects of the the development process.
YSlow
(Full disclaimer: I helped with YSlow development and I was the architect of YSlow 2.0 so this fact may or may not have something to do with why YSlow is the first in the list. Plus, this is an unordered list.)

YSlow is an extension to Firebug, that:
- inspects the DOM
- hooks into the Net panel to listen to network activity and discover components that are not part of the DOM
Then the tool looks at the page and the components and tries to figure out how closely they match with Yahoo!'s performance best practices. Then you're given a list of findings with some advice and links for more information on how to improve.
PageSpeed
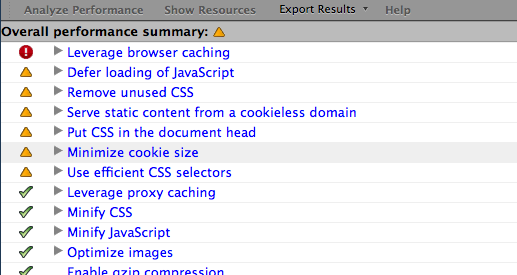
PageSpeed inspects the page and the components and checks it against conformance with Google's performance best practices.
In addition to that, PageSpeed has some quite advanced features like the Activity Panel which shows more detailed information on the page's, well, activity - such as the browser paint events, javascript parsing, execution, DNS lookups and so on. PageSpeed also tells you how many (and which) JavaScript functions were never called before onload so you can take some hints to lazy-load some of the JavaScript payload (after analysing, of course that the code is not needed in other browsers or other page use cases). Same with CSS - PageSpeed gives you a list of unused selectors so you can check whether you have leftovers from previous versions of the page.
MSFast

MSFast (from MySpace) inspects the page and helps answer many questions left open by YSlow and PageSpeed, such as:
- What's going on with IE?
- What's the memory and CPU footprint of your code?
- How does the page looks like (as in screenshots) while it's being loaded so you can see what the people with slower connections have to experience
PageTest

AOL's PageTest is an IE plugin but also a hosted service which is a great way to show your boss/client performance details without inconveniencing them with challenging download and installation activities. PageTest gives you a waterfall view of the page load and a checklist of things to improve, plus some screenshots of interesting moments during load and even a video - an excellent view of how the page looks like in slow speeds. The hosted service can show you the dial-up experience in 4 different places in the world.
DynaTrace's Ajax Edition
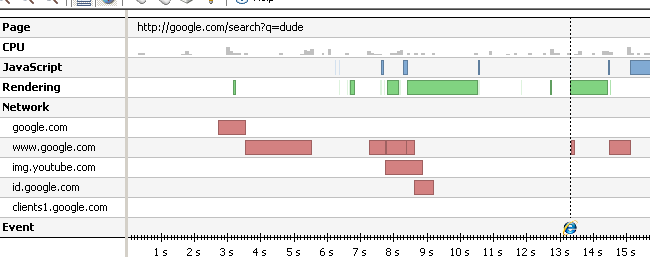
Dynatrace Ajax is a very detailed lower level tool that not only shows the waterfall of components downloads but also the rendering time, CPU consumption, JavaScript parsing and execution. The screenshot above is just the tip of the iceberg of the tool's plethora of views and insights. It's highly recommended. (free, registrationware)
Packet sniffers
A good packet sniffer is indispensable for inspecting the HTTP traffic and figuring out how the page loads and what the request/responses and their headers look like. Here's a list of recommended sniffers, each with something good on top of the others:
- IBM PageDetailer - a mature tool, somewhat simple which makes it a good start, requires registration to download
- Fiddler - very powerful, extensible
- HTTPWatch - (paid, but with a free version) integrates into the browser (both IE and FF) as a panel - very convenient to use. Extensible.
- Microsoft Visual Round Trip analyser (and an excellent writeup)- goes even lower into the packet level of the requests and draws a different view of the waterfall, one that visualizes the TCP packets and the TCP slow start. It also gives recommendations for performance improvements. Built on top of NetMon (Microsoft Network Monitor) to present the data in a more useful and friendly way.
- Charles proxy - the only non-windows tool in the list is an excellent packet sniffer for Mac
Time for a little rant - a more detailed view into the HTTP chunks is something that I think is important (will blog about it as part of this series) and missing from the current tools. HTTPWatch is the only tool that at least tells you the number of chunks and Fiddler prompts you to de-chunk HTTP responses when inspecting the body, which gives you a hint that the response was chunked. I hope to see more in that area, hopefully soon.
Thanks for reading
That concludes day 2 of the performance advent calendar. Hope you'll have fun installing and playing with new toys!
Did I miss a tool that should've been in the list? Let me know.
