I'm a sucker for consoles. The ability to quickly type some code and see it executed right then and there... priceless. That's why I'm a huge fan of Firebug's JavaScript console. But what about IE?
option 1 - Firebug lite
Firebug lite is a lighter version of the proper Firebug which runs in browsers other than Firefox. You "install" the bookmarklet and voila - JavaScript console and other goodies are available on any page.
You visit any page and click the "Firebug lite" bookmarklet...
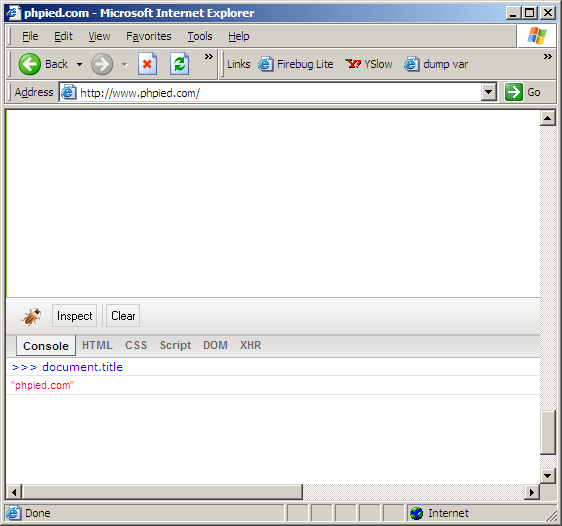
... then you hack away in the shiny console!
option 2 - built-in MS script editor/debugger
If you do any javascript in IE, it's a good idea to have this debugger guy enabled. There's actually at least three different debuggers, but one of them is already installed without you lifting a finger. If you enable it, you can debug any time there's a JavaScript error on the page. It also features a console! You can't get to the console unless there's a JS error, so you may need to cause the error yourself. Here's the step-by-step scenario.
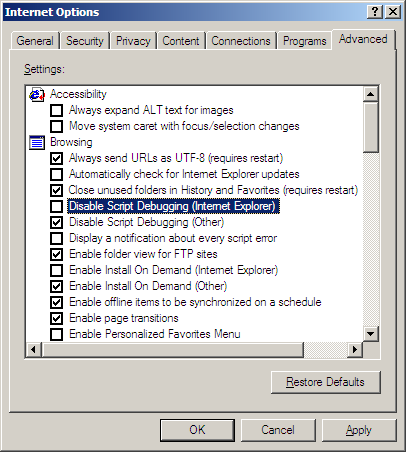
Go to menu Tools / Internet Options... / Advanced tab. Under the "Browsing" category uncheck the box that says "Disable Script Debugging"
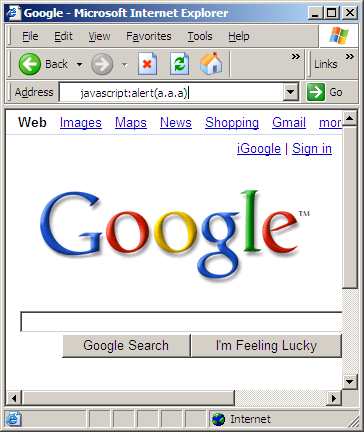
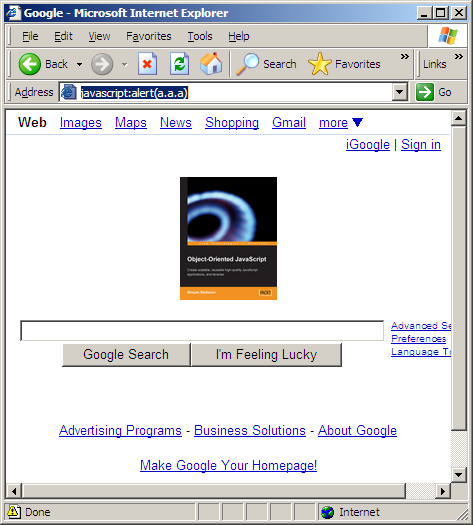
Go to any page and cause an error, by typing in the address bar some non-existing property or some non-existing object for example. Like javascript:alert(a.a.a)
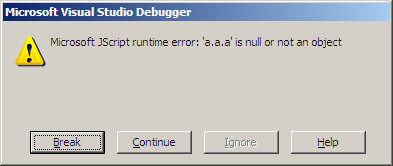
Non-surprisingly, you get an error, but now you have the option of debugging the error:

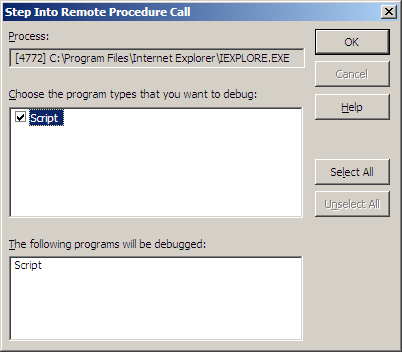
You're given a list of debuggers, in case you've installed more debuggers from MS. Select your debugger or just hit Yes:

Just say OK here...
Click "Break"...
Finally - a console! We're in! The console is the so-called "Immediate" window, which is not displayed by default. To see it go to menu Debug / Windows / Immediate. Then just start fiddling with the page. Type anything and hit enter to see it evaluated. You also list the properties of an object by typing its name, like document.images[0] or just document.
![Fiddle with document.images[0]](https://www.phpied.com/wp-content/uploads/2008/10/7-fiddle.png)
Once you've had your fun, stop debugging:

Enjoy the results of your hard work, a.k.a. replacing some logo with a shot of your favorite book 😉
Comments? Find me on BlueSky, Mastodon, LinkedIn, Threads, Twitter