2010 update:
Lo, the Web Performance Advent Calendar hath moved
Dec 16 This article is part of the 2009 performance advent calendar. Today's article is a contribution from Eric Goldsmith. Please welcome Eric and stay tuned for the articles to come.
 Eric Goldsmith (@GoldsmithEric), Operations Architect at AOL, has more than 20 years of experience providing technical leadership in the areas of product development, engineering and operations. At AOL he has led efforts to deliver the highest levels of performance and availability for top Web sites, including: AOL.com; AIM.com; and AOL Video; among others.
His areas of expertise include Performance Analysis, Capacity Planning, Network Engineering, and Software Development. Prior to AOL, Eric worked for companies such as UUNet, WorldCom and CompuServe, as well as telecom and Internet startups. He holds a BS in Computer Science from The Ohio State University.
When trying to quantify the performance of a Web site, we most commonly mean the response time. The two most common methods of gathering response time data are from Field Metrics and Synthetic Measurement.
Field Metrics measure response time from real user traffic, and generally rely on JS instrumentation of the pages, or toolbars to collect data. Synthetic Measurement involves loading pages in one of a myriad of tools designed to collect metrics. Each method has its strengths and weaknesses - but that's a discussion for another time.
Synthetic Measurement is an easy way to get started quantifying your site performance. But there are some important guidelines for getting accurate results.
Test Speed
A common mistake people make when testing the response time of a Web site is testing on their office network. According to Speedtest.net, my office network gives me 53 Mbps. A typical DSL user gets about 1.5 Mbps, or 35 times slower.
How much difference does this make in practice?

I tested cnn.com with Webpagtest at two different speeds. At DSL speeds (1.5 Mbps) it loads in ~15 seconds, while at FIOS speeds (20 Mbps) it loads in ~ 3 seconds - a 5x difference.
This demonstrates how a developer testing from his workstation in the office could see a 3s load time, and conclude that all is well. While a home user on DSL could see a 15s load time and abandon the site due to slowness.
As mentioned above, you can test at different speeds with Webpagetest. And if you want to simulate different speeds from your desktop, try AKMA Labs' Network Delay Simulator.
Test Location
Does a site perform differently from LA vs. NY? US vs. UK?
This double waterfall excerpt (the waterfalls from two test executions overlayed together) demonstrates the difference in response time for a page measured from East and West coasts.
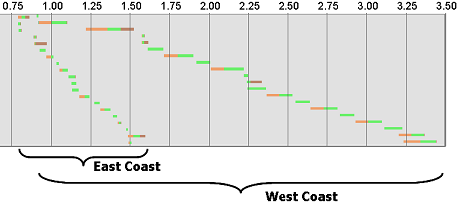
A difference of ~ 2 seconds of load time, based solely on where the measurement was taken.
Now, this is a particularly egregious example, and it's possible to design your site so geographic differences are minimized. But you have to know there's a problem before you can solve it.
So, where should you test your site? From where your users are. Most web analytics tools will provide this information. For example, here's what Google Analytics shows for Webpagetest:
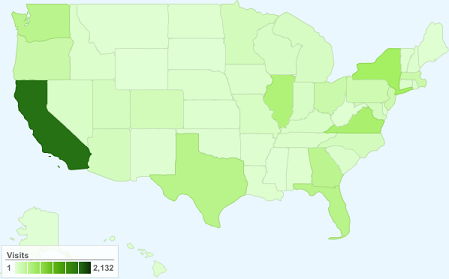
The ability to test from different locations is available from Webpagetest (if you're interested in hosting a location, let me know), and from Keynote via their KITE tool.
Test Iterations
Can you accurately determine the response time of your site with a single measurement?
The figure below is a typical response time distribution for a Web site.
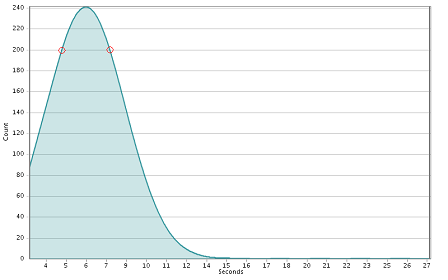
If you only took a single measurement, where would it fall on the distribution? For example, it could be the left-most red circle - or the right-most (or anywhere else). The delta between those two points is more than 4 seconds. So, what's the response time of your site?
There are two things to consider when trying to answer that: how many measurements (samples) do you need, and how do you coalesce them into a representative number?
Determining the number of measurements needed can get complicated. But in general, 30 or more is suggested.
How to aggregate all that data into a response time number is subject all it's own, and a whole 'nother discussion. It's common practice to just average them. That's not an ideal approach, but it's a starting point, and gets the dialog started.
Comments? Find me on BlueSky, Mastodon, LinkedIn, Threads, Twitter