Canvas pie
UPDATE: Translation in Brazilian Portuguese here, thanks Maujor!
OK, so you have an HTML table. Let's turn it into a pie chart with a bit of javascript.
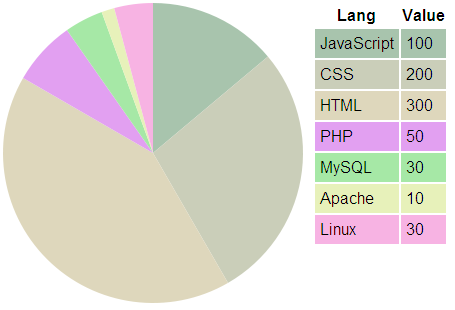
We'll be using the canvas tag, so the browser has to support it. For IE - well, you still have the table. That's why we'll call it progressive enhancement. Unobtrusive too. Here's a screenshot:

» The demo is here (refresh for new colors)
Here are the ingredients to the recipe:
- One
<canvas>tag - One
<table>full of data - javascript to get the data from the table
- javascript to plot the data on the canvas
One canvas tag
<canvas id="canvas" width="300" height="300"></canvas>
One table full of data
This is a bare bone unstyled old school table.
<table id="mydata"> <tr> <th>Lang</th><th>Value</th> </tr> <tr><td>JavaScript</td> <td>100</td> </tr> <tr><td> CSS</td> <td>200</td> </tr> <tr><td> HTML</td> <td>300</td> </tr> <tr><td> PHP</td> <td> 50</td> </tr> <tr><td> MySQL</td> <td> 30</td> </tr> <tr><td> Apache</td> <td> 10</td> </tr> <tr><td> Linux</td> <td> 30</td> </tr> </table>
javascript to get the data from the table
First, some setup. Let's tell the script which is the ID of the data table, the ID of the canvas tag and which column contains the data:
// source data table and canvas tag var data_table = document.getElementById('mydata'); var canvas = document.getElementById('canvas'); var td_index = 1; // which TD contains the data
Next, select all table rows, then loop through the rows, selecting all TDs. Add the data we need to a data array. While at it, run a total of the data in the column and also create an array of random colors. Paint each row with the selected color. (we'll see the actual getColor() in a bit.)
var tds, data = [], color, colors = [], value = 0, total = 0; var trs = data_table.getElementsByTagName('tr'); // all TRs for (var i = 0; i < trs.length; i++) { tds = trs[i].getElementsByTagName('td'); // all TDs if (tds.length === 0) continue; // no TDs here, move on // get the value, update total value = parseFloat(tds[td_index].innerHTML); data[data.length] = value; total += value; // random color color = getColor(); colors[colors.length] = color; // save for later trs[i].style.backgroundColor = color; // color this TR }
javascript to plot the data on the canvas
Time for the fun part, the drawing! First, we need to create a context object. Then figure out the raduis of the pie and the center, all based on the width/height pf the canvas tag:
// get canvas context, determine radius and center var ctx = canvas.getContext('2d'); var canvas_size = [canvas.width, canvas.height]; var radius = Math.min(canvas_size[0], canvas_size[1]) / 2; var center = [canvas_size[0]/2, canvas_size[1]/2];
Next, let's loop through data and paint pieces of the pie. To draw a piece of pie, you basically need to call these methods of the context object:
beginPath()- to start the piece of the piemoveTo()- to set the pencil in the centerarc()- draw a piece of a circlelineTo()- finish the circle piece with a line back to the centerclosePath()andfill()but set the fill color first.
Here's the actual code for this part, hopefully the comments help:
var sofar = 0; // keep track of progress // loop the data[] for (var piece in data) { var thisvalue = data[piece] / total; ctx.beginPath(); ctx.moveTo(center[0], center[1]); // center of the pie ctx.arc( // draw next arc center[0], center[1], radius, Math.PI * (- 0.5 + 2 * sofar), // -0.5 sets set the start to be top Math.PI * (- 0.5 + 2 * (sofar + thisvalue)), false ); ctx.lineTo(center[0], center[1]); // line back to the center ctx.closePath(); ctx.fillStyle = colors[piece]; // color ctx.fill(); sofar += thisvalue; // increment progress tracker }
utility
Here's the function that gives a random color:
// utility - generates random color function getColor() { var rgb = []; for (var i = 0; i < 3; i++) { rgb[i] = Math.round(100 * Math.random() + 155) ; // [155-255] = lighter colors } return 'rgb(' + rgb.join(',') + ')'; }
C'est tout! Enjoy your pie
UPDATE: Comment by Zoltan below, if you use Explorer Canvas, you can make this work in IE with only this:
<!--[if IE]><script type="text/javascript"
src="/path/to/excanvas.js"></script><![endif]-->
This entry was posted on Tuesday, February 5th, 2008 and is filed under canvas, JavaScript. You can follow any responses to this entry through the RSS 2.0 feed. You can leave a response, or trackback from your own site.
Get notification for future posts: follow me on Twitter or subscribe to my RSS feed

February 5th, 2008 at 1:25 pm
[...] I love it when a plan comes together (removes cigar): After I played with Google charts and porting the idea of generating charts from accessible table data over to YUI charts Stoyan Stevanof had to use the same idea to generate his own, home-made Canvas-driven charts: [...]
February 5th, 2008 at 1:31 pm
My browser (IE7 [Vista Home Premium]) shows JS-error.
February 5th, 2008 at 2:10 pm
[...] I love it when a plan comes together (removes cigar): After I played with Google charts and porting the idea of generating charts from accessible table data over to YUI charts Stoyan Stevanof had to use the same idea to generate his own, home-made Canvas-driven charts: [...]
February 5th, 2008 at 2:17 pm
Thanks Alexey, fixed now. I’m now checking if canvas is supported, my bad for claiming that it’s OK in IE without testing
Before the lat step (drawing) I now do:
if (typeof canvas.getContext === 'undefined') { return; }February 5th, 2008 at 4:32 pm
[...] I love it when a plan comes together (removes cigar): After I played with Google charts and porting the idea of generating charts from accessible table data over to YUI charts Stoyan Stevanof had to use the same idea to generate his own, home-made Canvas-driven charts: [...]
February 5th, 2008 at 11:06 pm
This is beautiful! Too beautiful.
I tested with Mac Safari, FF, and windows XP Ie7 and no browser has problem displaying this beautiful thing! Thank you!
February 6th, 2008 at 7:27 am
In IE6 it wont`t show up (i mean the pie), only html table showed. Other browsers (FF 2.0.11, Opera 9.25) show both, pie and table.
February 6th, 2008 at 11:51 am
Yes, Janek, IE6 don’t understand the canvas tag
February 6th, 2008 at 11:53 am
[...] phpied.com It’s your responsibility to die() if necessary… – PHP Manual « Canvas pie [...]
February 6th, 2008 at 12:05 pm
I got this to work in IE using ExplorerCanvas (http://excanvas.sourceforge.net/). By adding one line in the :
You can get this working nicely in IE.
Hope this is useful to someone.
Z.
February 6th, 2008 at 12:07 pm
Hmmm … I see this doesn’t entify tags … let me try one more time.
I got this to work in IE using ExplorerCanvas (http://excanvas.sourceforge.net/). By adding one line in the head, you can get this working nicely in IE.
Hope this is useful to someone.
Z.
February 6th, 2008 at 6:26 pm
[...] phpied.com » Blog Archive » Canvas pie (tags: javascript charting canvas accessibility programming google graph code chart table webdev web development) [...]
February 7th, 2008 at 5:55 am
Cool stuff, very useful.
I’ve wrapped up a quick jquery plugin around your code, the post is at http://blogs.atalayasec.org/dev/?p=9
March 8th, 2008 at 10:12 pm
[...] This is very flattering: Greg Houston took my script for DIY canvas pie and added tooltips and better colors logic. Here’s the result, it’s really nice, built with some MooTools. The tooltips are not supported in <canvas> but Creg used an image that overlays the pie and set the tooltips with an image map. Clever, isn’t it? [...]
April 5th, 2008 at 6:38 am
Excellent article. I’ve added values and indicators in my version. Check it out at http://www.mattknott.com/content/blog/2008/04/Advanced_Canvas_Based_Pie_Chart.html
June 4th, 2008 at 8:21 am
hey guys want to draw some animated chart’s, look what i have found visifire powered by silverlight offered under open source. just for Nothing(free)
December 4th, 2008 at 2:47 am
my script for DIY canvas pie and added tooltips and better
December 4th, 2008 at 2:47 am
Hmmm … I see this doesn’t entify tags … let me try one more time.
December 25th, 2008 at 8:22 pm
Very useful thanks, although im somewhat of a novice, this go’s a long way in helping me learn
many thanks again
Dave
May 16th, 2009 at 11:47 am
[...] the original here: Canvas pie / phpied.com Share and [...]
May 16th, 2009 at 3:38 pm
[...] This post was Twitted by davidrvega – Real-url.org [...]
June 2nd, 2009 at 3:31 am
It’s lightweight, works great. I think it’s more readable if the data is pre-sorted large to small. I also swapped out the color function with the one used by Greg Houston
http://blog.greghoustondesign.com/canvas-pie-chart-with-tooltips/
just because I wanted the colors to be bolder and consistent. Thanks a lot for doing this!
October 26th, 2009 at 12:44 am
great code samples for canvas beginners
text to canvas
1.
how I can put entire html document to a canvas ?
including ofcourse it’s font design , so it will be looked on canvas as the original html
2. get ‘text’ drawed in canvas
how on mouse over on canvas or drawing rectangle zone I can get the text ‘under’ ?
any code sample or link will be appreciated
February 1st, 2010 at 3:12 am
beautifully done, like a work of art. I’m interested in uitilising this feature more for my own personal use. I’ve checked out the below version and it is worth a look:
http://www.mattknott.com/content/blog/2008/04/Advanced_Canvas_Based_Pie_Chart.html
February 26th, 2010 at 11:05 am
Hmmm … I see this doesn’t entify tags … let me try one more time.
I got this to work in IE using ExplorerCanvas (http://excanvas.sourceforge.net/). By adding one line in the head, you can get this working nicely in IE.
Hope this is useful to someone.
http://www.doktortr.net/
March 15th, 2010 at 5:48 am
how do you do if you want six pie chart in one page?
December 8th, 2010 at 10:05 am
Mit den besten Wuenschen fuer frohe Weihnachts Feiertage. Greetings and best wishes for a happy Christmas.
March 10th, 2011 at 10:12 am
Excellent job!!!
But it seems that recent versions of Internet Explorer need this line in the header of html to display the chart:
(insert this line before ….)
Cheers
March 10th, 2011 at 1:30 pm
Sorry Here below the line missing:
<meta http-equiv=”X-UA-Compatible” content=”IE=7″>:
March 22nd, 2011 at 4:42 pm
I would like know a way to write data to the canvas from a JavaScript Array instead of from a table.
if you have an answer, please contact me via http://ngranger.110mb.com/Files/Contact_Form.html
June 13th, 2011 at 10:12 am
[...] of a Pie Chart that I used for inspiration – and to borrow some JavaScript code from: http://www.phpied.com/canvas-pie/. Tags: canvas, dbms_epg, listagg Share this [...]
August 9th, 2011 at 5:25 pm
I have a complicated task to do where I need to get the (x, y) of the end angle, the point where the line is drawn back to the center and cuts the pie pieces. In this case, it would be each of the points at the end of the radius at ‘Math.PI * (- 0.5 + 2 * (sofar + thisvalue)),’
I can’t figure out how to find each of those points, I know all that is needed exists in order to find it but not sure how to calculate it.
Anyone have any ideas?
January 6th, 2012 at 10:10 am
this is not worked for me
January 6th, 2012 at 10:12 am
please provide code snippet that works in IE 8.
February 22nd, 2012 at 11:10 am
[...] HTML 5 Canvas Pie Charts Source: Stoyan Stefanov Excerpt: [...]
March 1st, 2012 at 8:31 am
[...] of a Pie Chart that I used for inspiration – and to borrow some JavaScript code from: http://www.phpied.com/canvas-pie/. canvas dbms_epg [...]
July 27th, 2012 at 8:14 pm
Scott, it’s nice to meet you. I hope Shutterstock will continue to accept my scientific work. Shutterstock now has a educational micrograph (photos taken with a microscope) section second to none.
July 30th, 2012 at 9:59 pm
Well, I’m not going to value this site unless they create such a system that I might able to download foods right from my screen. lol
November 1st, 2012 at 3:19 am
Wow… HTML5 charts are simply awesome. No more plugins or extra features. Nice. But I was wondering about a fallback if the browser does not support HTML5 then? I guess in that case, it must be replaced by an image or something similar… Do you have any better option?
April 27th, 2013 at 2:48 am
Hi there, its fastidious post concerning media print, we all understand media is a great source of information.
May 13th, 2013 at 3:35 am
Hi there! Do you use Twitter? I’d like to follow you if that would be okay. I’m definitely
enjoying your blog and look forward to new posts.